This VW Golf (1.8, 20 valve, turbo, engine code AGU) was presented to me with the fault described as a misfire at 2000 rpm. The car had recently been purchased from a local dealership as a trade-in, so the new owner had limited experience of its previous history and performance. A quick road test revealed that the performance was below expectations, with a mild kangarooing under load. With the absence of any trouble codes, I have to admit that initially I went off on a tangent with the diagnostic approach and decided to look at the turbo as the culprit (more of that later).
I measured the turbo boost pressure by connecting into the small vacuum pipe that connects the fuel pressure regulator to the inlet manifold. The pressure measured was 7.5 psi under full boost on the road. I am relatively inexperienced at fault-finding on turbocharger systems and have never had cause to measure this before on any car. With no previous experience to draw upon I turned to the dealer technical information system, which quotes 1.500 - 1.650 bar (absolute).
Again my inexperience led me astray here, as I was converting 1.5 bar into 22 psi (near enough) and after some discussion it became apparent that I was ignoring the Ī«absoluteĪ» htmlect. Funny, I think, how we tend to take terms like Ī«MAPĪ» for granted and donĪ»t really consider the exact meaning (maybe I am alone here). Anyway, the point is that I should have taken atmospheric pressure into account in my calculations. So the pressure I was seeing was actually above specification (contrary to many opinions I received). Still I pursued the Ī░lack of boostĪ▒ as a probable cause, and further tests proved that the overrun pressure release valve had failed. A new valve was fitted and a small improvement was noted in the Ī░kangarooingĪ▒, but the performance was still below expectations. All reasonable tests were carried out: smoke-testing the charge pressure intake, exhaust back pressure (blocked cat/exhaust), N75 valve operation, etc. No further faults could be found.
After a bit of time out from the job, I thought about performing a scope trace of the injector durations and the oxygen sensor whilst driving under load. My thoughts were that if the boost pressure was OK then maybe there was a fuelling issue, and maybe I could see from the injector durations if the PCM was commanding an appropriate injector duration for a given throttle input.
With 10 seconds on screen, here is a Ī░helicopter viewĪ▒ of the whole acceleration event taken during a road test:
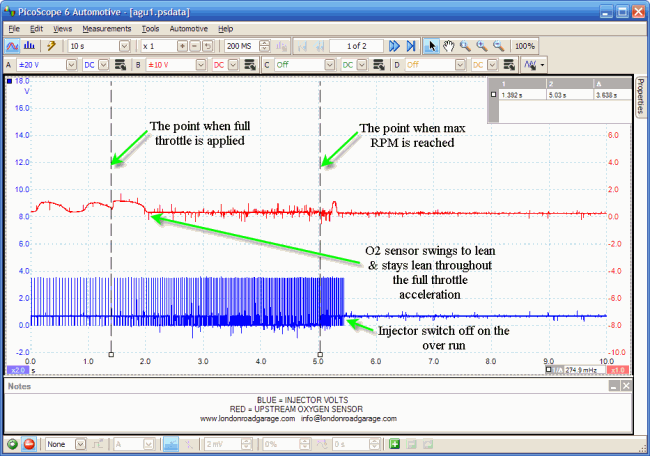
It soon became clear that there was a fueling issue, as the lambda sensor was reporting a lean state right throughout the acceleration period. The injector durations can be seen clearly when zoomed in, and the point when the throttle is applied can be easily identified. This capture led me to the idea that the turbo pressure was adequate and that there simply wasnĪ»t enough fuel available to utilise the available air being inducted. My attention turned to fuel pressure.
I have a fairly typical fuel pressure testing kit that many workshops use and I have always found it suitable for my needs. I performed the usual test that I carry out, by testing pressure with the engine idling and then opening the throttle to see that the pressure increases. Although the figures I noted were very slightly below those quoted in the dealer technical information, they didnĪ»t strike me as odd. That came only after posting my results on the web and picking up on the comments in a response. It was suggested that the fuel pressure should increase above the figures quoted in the specifications and that, under boost conditions, the actual boost pressure needs to be seen in the fuel pressure readings. I had never heard or considered this before. Next day I tried a simple test on my own naturally htmlirated 1994 2.0 litre Mondeo Zetec. The measured fuel pressure did in fact rise as I applied pressure to the fuel pressure regulator. For every PSI that I added, the fuel pressure increased accordingly.
Back to the Golf, when I tried the same test I noted only a 2 psi increase when I applied 15 psi to the fuel pressure regulator vacuum connection. Maybe I was onto something! Next I tried what one guy calls the Ī░dead head testĪ▒ where basically I clamp off the fuel return pipe and monitor the pressure reading. The increase in pressure was not great and only 54 psi was noted. I had a Skoda Octavia available with a similar system to do a comparative test, and the Ī░dead head testĪ▒ on that car displayed an instant whopping 90 psi. I had previously thought it safe to assume that the flow rate was adequate due to the fact that I noted a constant fuel pressure whilst under load (on the road). This turned out to be not the case. I wondered what the fuel pump current would look like. Would I see a dodgy segment on the commutator? Would I see the expected rise in current draw?
The current draw displays nicely what I was seeing on the pressure gauge, and zooming in for a closer look at the commutator segment waveforms shows that they are ok. I think that it is safe to say that the pump is Ī░freewheelingĪ▒ to a certain extent, or maybe dragging air. In the animation above, you can see the difference in the current draw that the new pump made. The fuel pressures increased significantly too, although not to the amazing 90 psi that I witnessed on the Octavia. A road test proved the fix beyond doubt.
Here is the same Ī░helicopter viewĪ▒ capture that I did before, but now in animated form it shows the before and after capture and the expected rich period during acceleration:
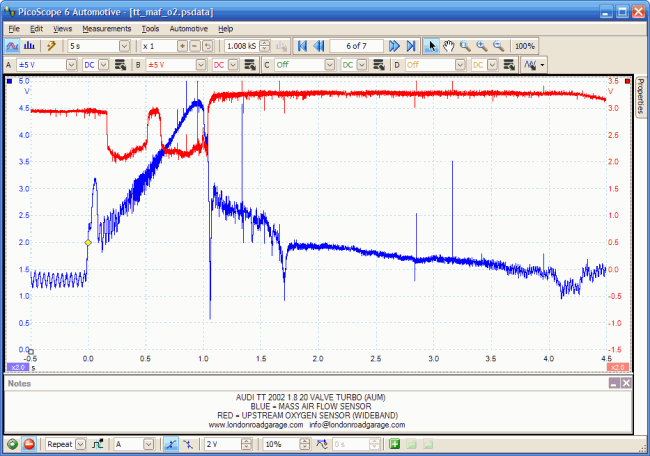
Here is another capture that I learned from Frank Massey. Studying the relationship between the MAF sensor and oxygen sensor can reveal a lot about the functionality of the closed loop fuel system. Frank mentions that he performs this test often and I reckon this displays the merits of the test quite nicely:
Here is the same capture, but this time from an Audi TT with a very similar setup, with the one significant difference that it utilises a wideband O2 sensor. The oxygen sensor waveform needs to be interpreted differently, as it is inverted compared to a zirconia-type signal.
Anyway, I digress. I mentioned earlier that I went off on a tangent on this job and wasted too much time following the wrong path. Mostly down to my own lack of experience in this kind of fault. Also I was hindered also by live data on the scan tool freezing at anything over 2000 rpm, making serial diagnosis awkward.
As well as learning the things that I have mentioned, I have also learned that I need to develop a more structured approach to fault-finding. Hopefully I will learn to stand back a little and see the wood for the trees! Ųõ╦³▌oī¦┘Y┴Ž >
|